We make sense of the data from your plant
Industrial data analytics and IoT. We read what your machines, silos and rooftops measure, and tell you what it means before the line stops.
- Week 3 · 3.5 mm/s average. Peak at 03:12. It is pump 2 starting up with no load, not a fault.
- Week 5 · 2.6 mm/s average. After lubrication on 2 September vibration drops by 18%.
- Week 9 · 3.6 mm/s average. Rising 0.4 mm/s a week. It will cross the warning threshold around 14 October: the bearing should be checked before then.
We research and certify with people who know the field


 Board of trustees
 Chair
 Board of directors
 Board of directors
 Industry 4.0 working group
 Secretariat of CTN-UNE 71/SC 41 IoT and digital twins


 Start-up
 NQA certified
 Finalist
 Castilla y León accelerator
Start with one machine and grow when it makes sense
There’s a machine that worries me
The one that stops without warning. We fit it with sensors, read its signal for a few weeks and tell you what is wrong and when to step in.
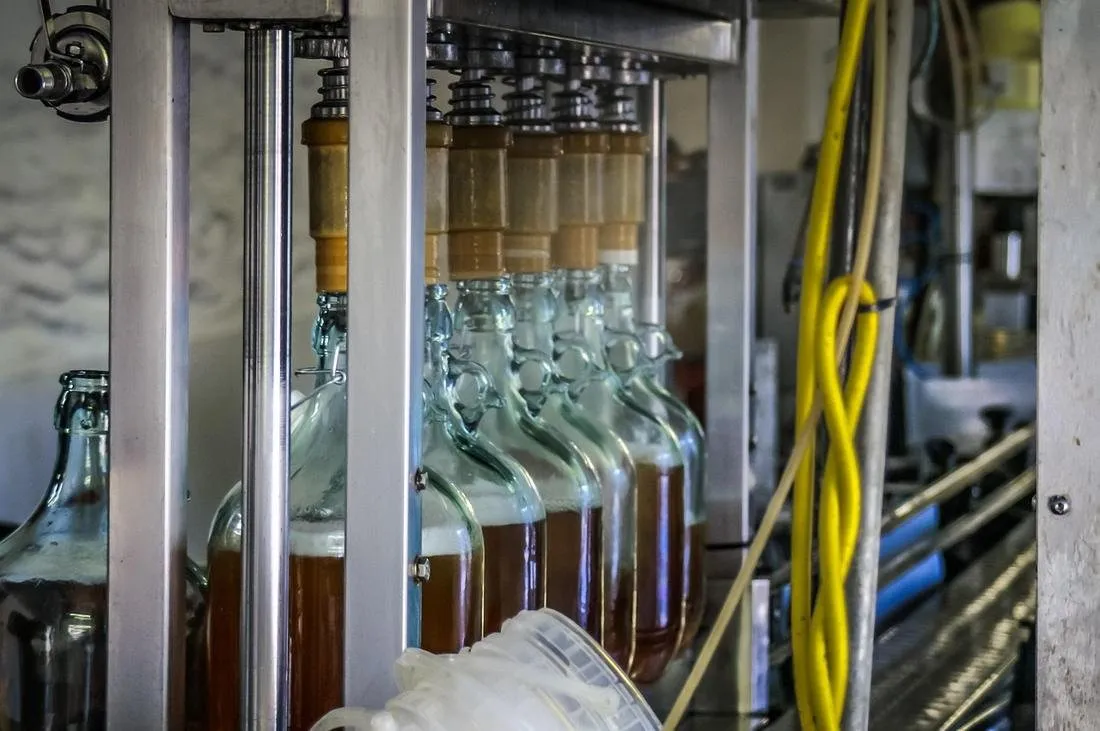
I want to see my whole plant on one dashboard
We connect sensors, PLCs and ERP. Consumption, temperatures and stoppages in one place, with alerts when something goes out of range.
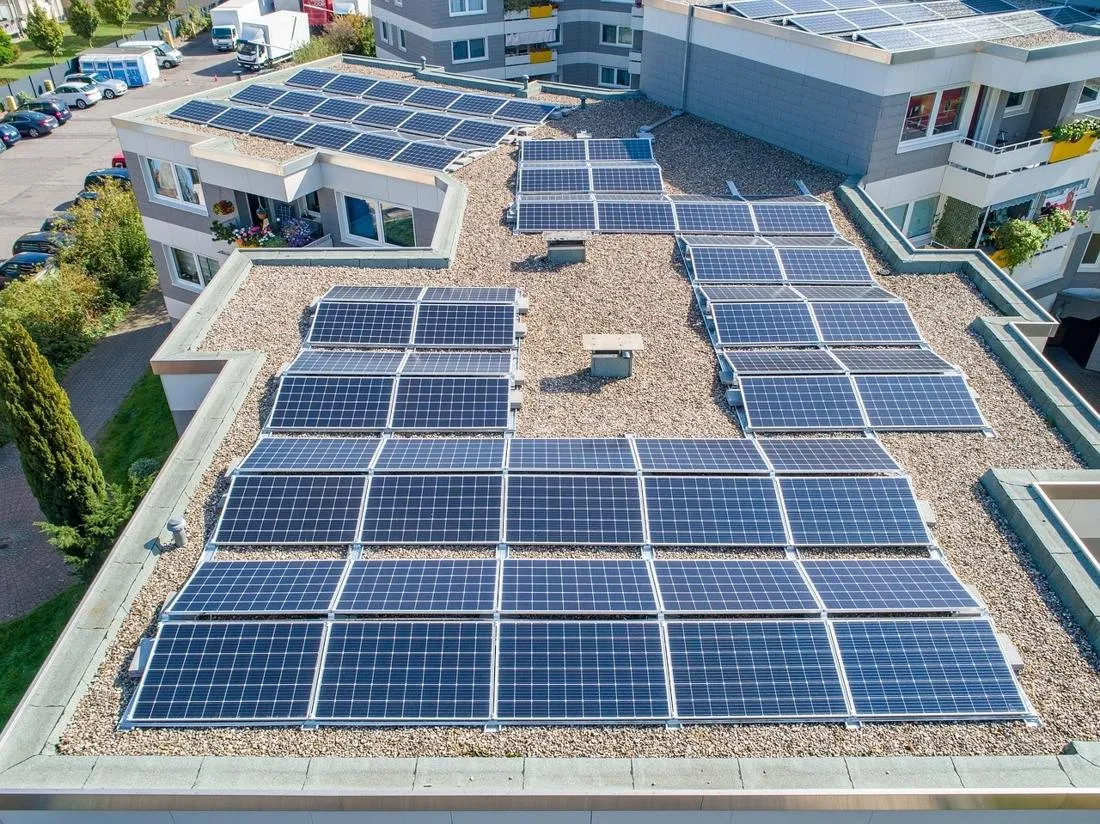
I have several plants and want to compare them
A single system for all your sites, and a digital twin to test changes before touching any of them.
A machine gives no warning before it stops. Its data does
We measure vibration in your motors to anticipate the failure before the stoppage
We measure pressure in your circuits to log every reading without walking over to check
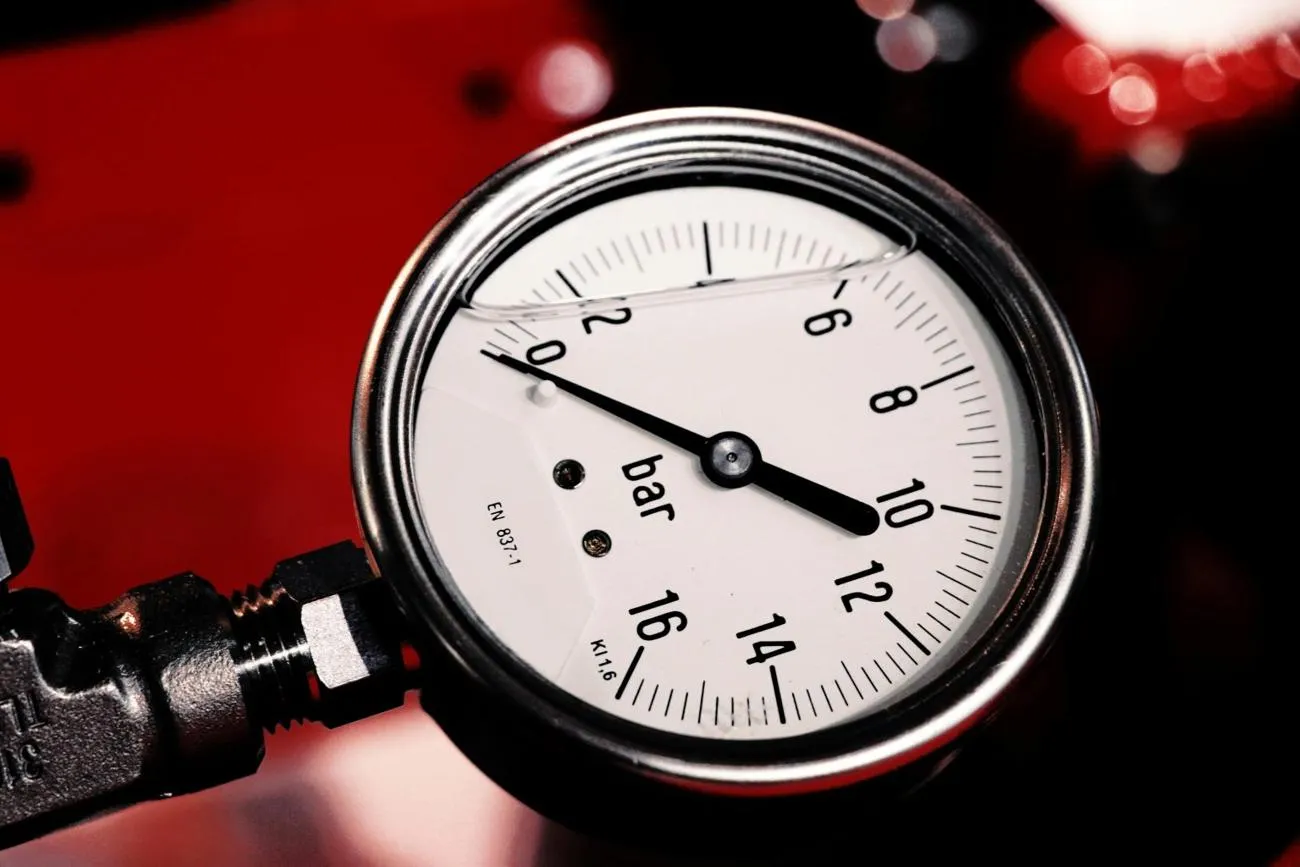
We measure temperature and oxygen in your compost piles to compost with minimal intervention
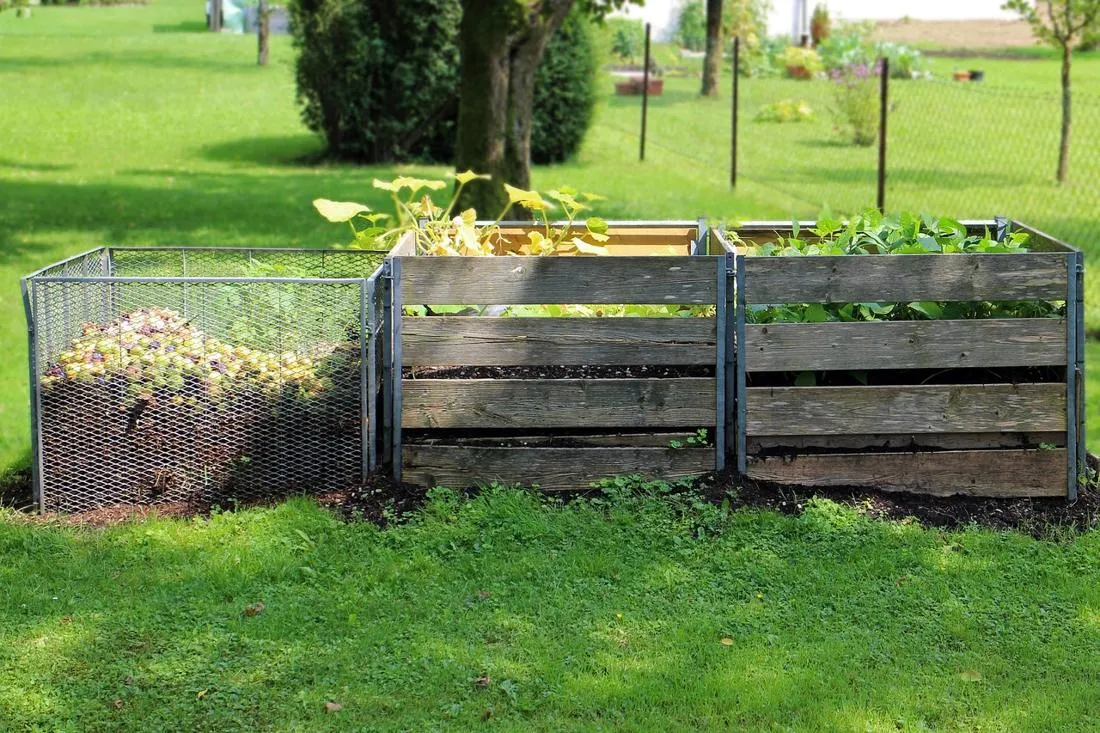
We measure the heat of each panel in your rooftops to find the failing module before output drops
What does an unexpected stoppage cost you?
Enter a number between 0 and 99.
Enter a duration between 0.5 and 72 hours.
Enter an amount in euros, from 0 upwards.
Today, stoppages cost you
172,800 €
a year. If you anticipate 30%, you stop losing 51,840 €.
Check the highlighted figures and you will see the calculation here.
Calculated only with your figures. It is not a promise of savings: the assessment tells you how much can really be anticipated.
From measuring to anticipating, in five steps
Same machine, same signal. Each step gets a little more out of it, and you can stop wherever it makes sense for your plant.
First, get the data flowing
We install sensors where they are needed or read the ones you already have in the PLC or SCADA, without touching production.
What you getData arriving on a dashboard every minute.
Then, understand what is happening
We clean the signal and cross it with shifts, batches and stoppages. Patterns nobody had seen start to appear.
What you getA first report: what happens, when and why.
Thresholds that warn in time
We set limits with your maintenance team. When they are crossed, an alert and a work order are triggered.
What you getAlerts and a record of every intervention.
Know when it is going to fail
A model learns from the history and estimates when the threshold will be crossed, with its margin of error.
What you getProbable failure date and margin, updated every day.
Test before touching the plant
A digital twin simulates what happens if you change the load, the shift or the speed, and compares scenarios.
What you getCompared scenarios, so you decide with numbers.
Four sectors and their perennial problems
Industry
Stoppages nobody sees coming, forklifts and pedestrians in the same aisle, tightening torques with no record.
02Energy
Panels, wind turbines and buildings measured from the air and from inside; technicians trained in the installation’s twin.
03Agri-food
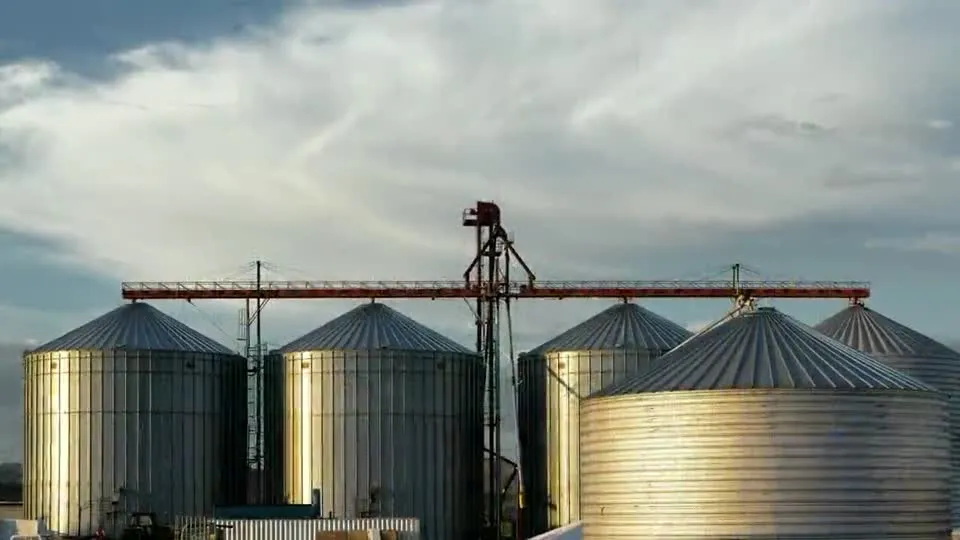
Silos, compost and produce measured without touching them; the warehouse kept safe.
04Health
Physical and cognitive rehabilitation in virtual reality with a record of every session, and buildings people can find their way around unaided.
SolutionProductProject
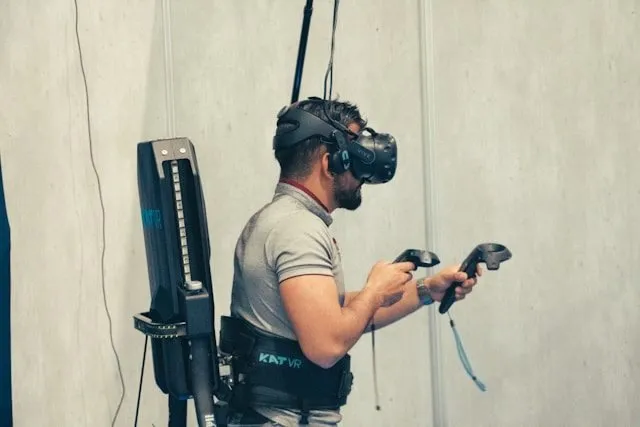
Train your team inside the machine before it arrives
A virtual reality platform where you really walk. We build the digital twin of your machine from its technical documentation, and your operators practise operating it, maintaining it and handling its risks without stopping production.
- What it is
- Virtual reality platform with natural walking
- What for
- Training in operation, maintenance and risk prevention
- Technology
- Virtual reality and digital twin
- Development
- With the University of Salamanca
- Funding
- ICE · ERDF
A compost pile that warns you when it needs air
Temperature, humidity and oxygen sensors, and an algorithm that decides when to turn the pile. Compost with minimal human intervention.
- Sector
- Agri-food
- Partner
- University of Valladolid
- What is measured
- Temperature, humidity, O₂
- Technology
- Sensors and artificial intelligence
What people ask us before getting started
If your question isn’t here, ask us during the assessment.
What does an industrial data analytics company do?
It collects the data from your machines and installations, cleans it and turns it into decisions: when to step in, what to adjust and what you save. If sensors are missing, we fit them; if you already have them, we read them.
Which sectors do you work with?
Industry, energy, agri-food and occupational health, from Palencia.
Where do we start?
With an assessment: we look at which machine or process worries you, what data already exists and what would need to be measured.
Can older machinery without a PLC be monitored?
Yes. External vibration, temperature or consumption sensors are added without having to touch the machine’s controls.
What is the difference between preventive and predictive maintenance?
Preventive maintenance acts on a schedule or by hours of use. Predictive maintenance acts when the machine’s data shows a failure is approaching.
What is a digital twin?
A virtual replica of a machine, a plant or a process, fed with real data, that lets you test changes before making them.
How much history is needed to predict failures?
It depends on the machine and the failures on record. That is why the method starts with capture and analysis: the assessment tells you when a predictive model makes sense.
Does production have to stop to install sensors?
Usually not. Installation is planned with your team to use scheduled stoppages, or done with the machine running when it is safe.